
The scale of the plastic waste issue is getting worse not better, with the production of plastics expected to double over the next decade. Yet efforts are being made to reduce or ban plastic in many parts of our lives by danger-aware and innovative organizations.
The scale of the plastic waste issue is getting worse, not better, with the production of plastics expected to double over the next decade. Yet, efforts are being made to reduce or ban plastic in many parts of our lives by danger aware and innovative organizations. Opportunities and challenges linked to plastics are increasingly global and addressing them will significantly contribute to achieving the 2030 Sustainable Development Goals.
Read on to discover what our robot, Athena, thinks the future of plastics could be, act accordingly, or click any link to read the evidence she found in 1,514 reports, articles and PowerPoints from the Web and Social Media in a few seconds.
If you are new to foresight, we recommend you view this slide presentation first to get the best out of this report.
Summary
Drivers
Environmental concern leads to these initiatives:
- Reusable coffee cups will be de rigueur in France by 2020 as it has boldly become the first country in the world to ban disposable plastic cups, plates, food boxes and cutlery.
- InterContinental Hotels Group has announced that it will remove plastic straws from its global estate of more than 5,400 hotels by the end of 2019.
- Corona has announced that it will be launching a pilot program in 2019 for 100 percent plastic-free six-pack rings, making it the first global beer brand to attempt such eco-friendly packaging.
- Single-use plastics will be removed from global events such as car launches, as well as from all offices and restaurants in Volvo Cars facilities in China, Belgium, the United States, Sweden and Malaysia.
- The UK Plastics Pact is the first of its kind in the world, led by WRAP which is a not for profit organisation.
- Earth Day Network will focus on mobilising the world to End Plastic Pollution.
Analysis
This summary analysis draws from our robot's below visualizations of the future of drones and draws from different vantage points to tell the story of what's emerging just like a GPS system.
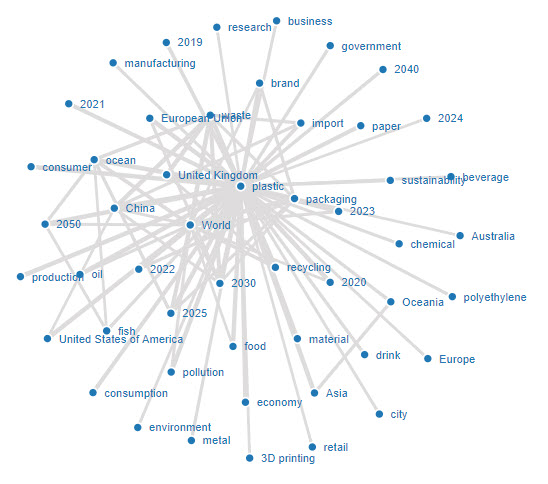
Systems map: Plastic use is all around every one of us but is giving serious cause for concern due to its non-biodegradability. Early efforts by governments to reduce plastic use and new forms of sustainable packaging and materials signal that every organization will have to review its policies and act fast to ensure continued consumer support and achieve future environmental next practice.
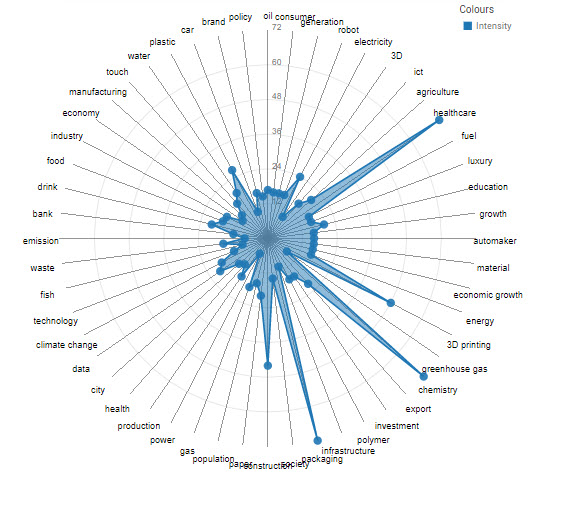
Radar chart: Use of plastics in healthcare, 3D printing, construction. packaging and manufacturing will come under increasing scrutiny and be subject to regulation to reduce the increasing amount of pollution now threatening our environment. New replacement plastic chemistries and the use of substitute biodegradable materials will come to the fore.
Spline chart: Peak activity in terms of plastic reduction is likely to be between now and 2026 with continuing efforts throughout the century. Initially, the knee jerk reaction will be calls to ban or tax plastics where easy pickings can be found. But more sophisticated substitutes are likely on harder to replace plastic items as the pressure to solve pollution problems mount. This will be a tough road to follow for many organizations' so the time is now to fully audit plastics use and begin the conversion process to more environmentally sustainable materials.
To begin your journey we recommend you read this great story about someone whose been there and got the tee-shirt: https://www.greenbiz.com/blog/2014/09/03/20-years-later-interface-looks-back-ray-andersons-legacy.
There are many parallels here with plastics especially in Ray Anderson's insistence that Interface's carpets would be 100% sustainable and nothing less would do: imagine your organization 100% plastics free.
Sentiment: The sentiment chart tells a somewhat mixed story. There are many positive sentiments being expressed by pundits and experts who see great potential growth for traditional plastics over the next 30 years and somewhat less so for innovative replacement materials. But these generally exclude increasing efforts to reduce the use of plastics due to environmental concerns. With China banning plastic waste imports and potentially other countries following suit, greater regulation around the world and action groups increasingly vociferous we believe that negative sentiment will increase quite substantially.
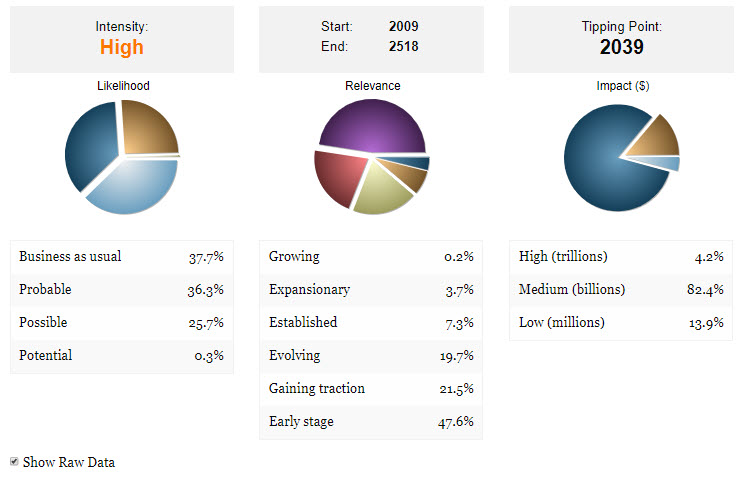
Pie Charts: The growth of and concerns about plastics are rated as of high intensity, one notch from the top ranking of very high. The tipping point for public acceptance of new ways of manufacturing and substituting for plastic products will take another generation. Athena's calculation suggests that 2039 is most likely. Just like smoking it will take a while to wean the world off plastic. Meanwhile plastic waste entering the oceans and soil will likely take 500 years to degrade creating health risks for fish, animals, birds and ultimately, humans!
We can expect future class-action suits against laggard major plastics polluters because the issue has been regularly discussed in public since at least 2009.
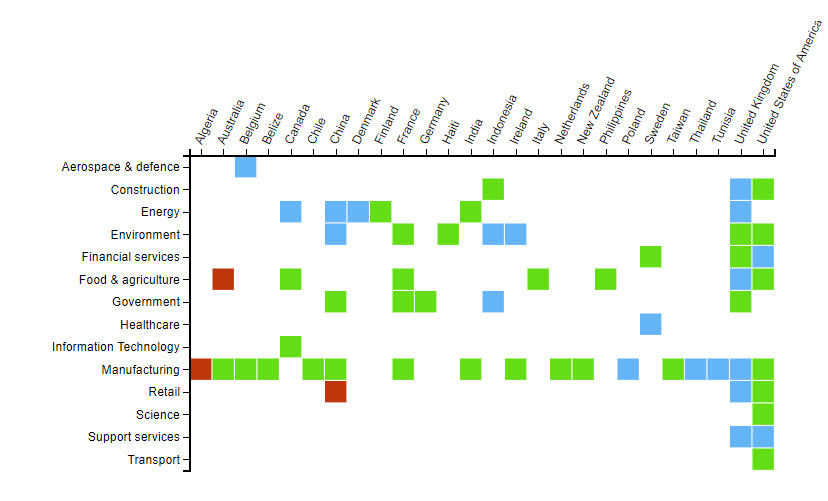
Heat map: The heat map shows just how urgent the problem is with hardly any country or sector having a very high focus on minimising plastic use. Efforts are at early stage at best.
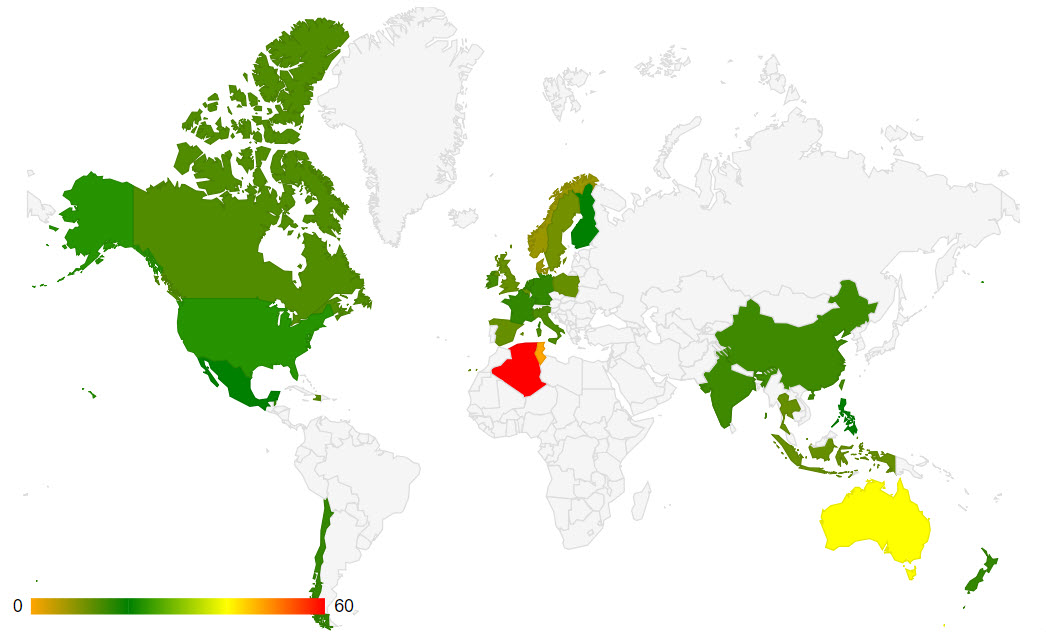
Geography: The regions of the world with the most plastics use are Australasia, Asia, Europe and North America. Governments on these regions and major corporations will have to do a lot more to get on top of plastics policies in very short order.
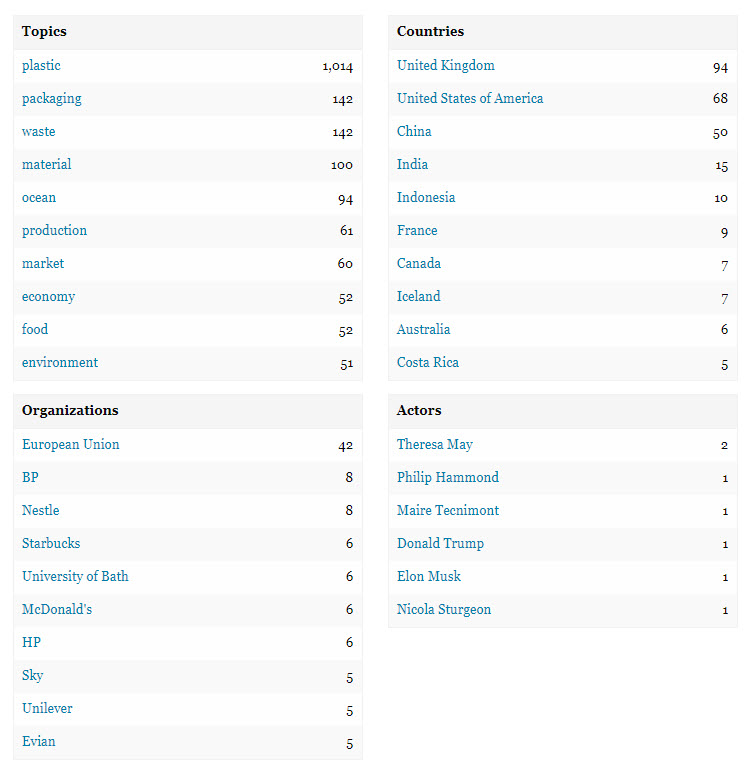
Leader board: The leader board indicates that the European Union is likely to lead the charge in improving plastics policies and in regulating and taxing their supply and demand. It remains to be seen if the US and China will follow the EU's lead and change the existing paradigm.
SWOT: Lastly, the SWOT chart shows many opportunities for plastics but there are plenty of weaknesses and threats too. The time for action by every responsible organization is now before the positive outlook reverses.
Potential Solutions
- The Procter & Gamble Company will be mass-producing the world's first recyclable shampoo bottle made from up to 25% post-consumer recycled beach plastic, using TerraCycle and Suez to help develop the bottle.
- The oil sector's outlook for growth in demand for oil and plastics could prove wrong if governments around the world introduce regulations to reduce fossil fuel consumption in their fight against pollution and global warming.
- Bioplastics could be part of the solution to the world's current plastic challenges.
- Plastic foam used for carryout food containers could become a new part of the mealworm's diet and in the process solve a major garbage problem.
Visuals
For more detailed explanation of the graphics below please click here. All outlooks based on 2025 unless otherwise stated.
System map
Plastic use is all around every one of us but is giving serious cause for concern due to its non-biodegradability. Early efforts by governments to reduce plastic use and new forms of sustainable packaging and materials signal that every organization will have to review its policies and act fast to ensure continued consumer support and achieve future environmental next practice.
Radar chart
Use of plastics in healthcare, 3D printing, construction. packaging and manufacturing will come under increasing scrutiny and be subject to regulation to reduce the increasing amount of pollution now threatening our environment. New replacement plastic chemistries and the use of substitute biodegradable materials will come to the fore.
Spline
To begin your journey we recommend you read this great story about someone whose been there and got the tee-shirt: https://www.greenbiz.com/blog/2014/09/03/20-years-later-interface-looks-back-ray-andersons-legacy.
There are many parallels here with plastics especially in Ray Anderson's insistence that Interface's carpets would be 100% sustainable and nothing less would do: imagine your organization 100% plastics free.
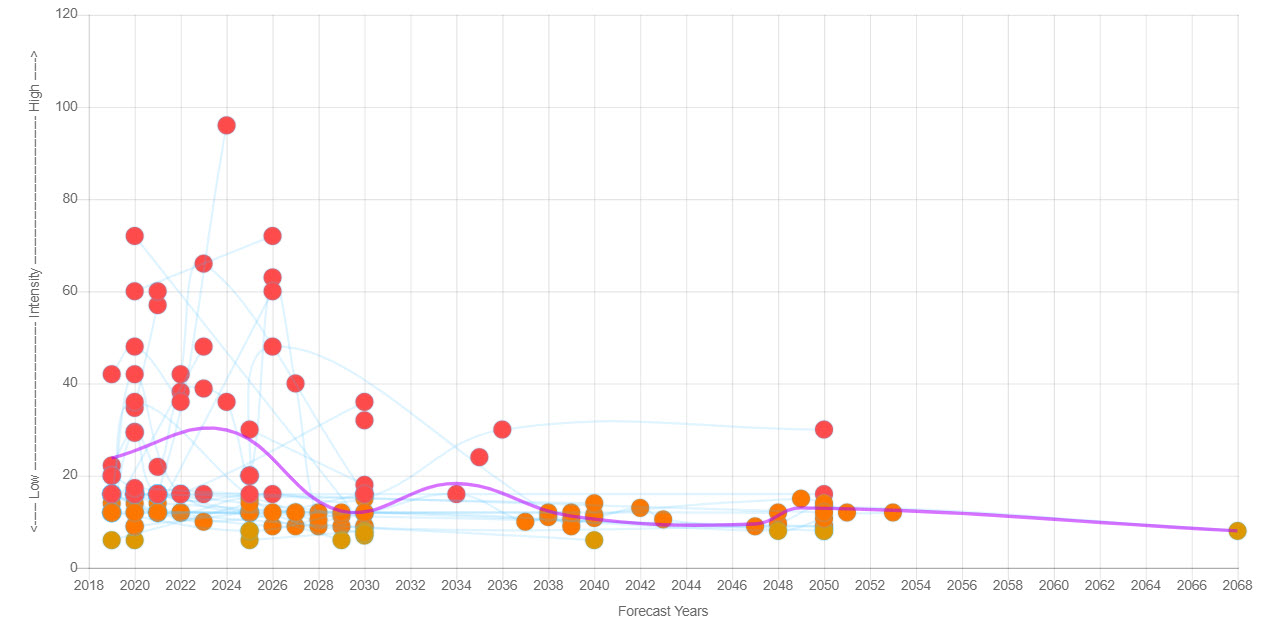
The blue line represents the five-year moving average of the aggregated splines that can be seen in background.
Sentiment
The sentiment chart tells a somewhat mixed story. There are many positive sentiments being expressed by pundits and experts who see great potential growth for traditional plastics over the next 30 years and somewhat less so for innovative replacement materials. But these generally exclude increasing efforts to reduce the use of plastics due to environmental concerns. With China banning plastic waste imports and potentially other countries following suit, greater regulation around the world and action groups increasingly vociferous we believe that negative sentiment will increase quite substantially.

Pie Charts
The growth of and concerns about plastics are rated as of high intensity, one notch from the top ranking of very high. The tipping point for public acceptance of new ways of manufacturing and substituting for plastic products will take another generation. Athena's calculation suggests that 2039 is most likely. Just like smoking it will take a while to wean the world off plastic. Meanwhile plastic waste entering the oceans and soil will likely take 500 years to degrade creating health risks for fish, animals, birds and ultimately, humans!
We can expect future class-action suits against laggard major plastics polluters because the issue has been regularly discussed in public since at least 2009.
Heat map
The heat map shows just how urgent the problem is with hardly any country or sector having a very high focus on minimising plastic use. Efforts are at early stage at best.

Geography
The regions of the world with the most plastics use are Australasia, Asia, Europe and North America. Governments on these regions and major corporations will have to do a lot more to get on top of plastics policies in very short order.
Leader board
The leader board indicates that the European Union is likely to lead the charge in improving plastics policies and in regulating and taxing their supply and demand. It remains to be seen if the US and China will follow the EU's lead and change the existing paradigm.
SWOT
Lastly, the SWOT chart shows many opportunities for plastics but there are plenty of weaknesses and threats too. The time for action by every responsible organization is now before the positive outlook reverses.

Evidence
Search term: “Plastic*”. Use this search term to explore our database for more knowledge and wisdom and latest data and information on the topic.
rate
- The rate of plastics production is dramatically accelerating: Industry projects a 40 percent increase in the next decade.
- The global plastic food container market is expected to grow at a compound annual growth rate of 6.3 percent through the year 2026.
- Market Research Future reports that the global plastic packaging market is expected to cross the USD400 Bn mark, at a growth rate of CAGR 5% over the forecasted period (2016-2022).
- The U.S. plastic recycling rate could drop to 2.9 percent if the proposed Basel Convention amendment passes or if other Asian countries join China in banning plastic waste imports.
- The U.S. plastic recycling rate will sink from 9.1 percent in 2015 to 4.4 percent in 2018.
market
- 70 companies have already made pledges, which will increase the market for recycled plastics by at least 60% by 2025.
- Around 95% of the pods on the market are estimated to be made from a mixture of plastic and aluminium, making them hard to recycle, with Halo estimating that 59 billion will have been produced globally in 2018.
- Initiative taken by the Government of India in 2018 to ban plastic use is expected to drive the market for RPET.
- The aerospace plastics market is projected to grow from USD14.7 billion in 2018 to USD20.7 billion by 2023 at a CAGR of 7.1% from 2018 to 2023.
- In May, Total signed a USD1.5 billion deal with Algeria's Sonatrach to build a polypropylene plant in western Algeria that will supply plastic to the Algerian and wider Mediterranean market.
packaging
- 70% of Australia's plastic packaging will be recycled or composted by 2025.
- One of the key trends for 2019 will be a shift to more plant-based dining, which will not only mean swapping meat for veggies on menus but also plastic for compostable packaging.
- Eco packaging will make an even greater appearance in 2019, as more cities around the world ban single-use plastics and/or impose plastic bag taxes.
- Liquid packaging and food service grades of paperboard are expected to grow 1.8% in 2018 and approximately 1% in 2019, due to continuing shift favoring paperboard packaging over plastics and polystyrene foam for environmental reasons.
- IDFA members are among the 250 companies worldwide that have pledged to eliminate plastic waste by 2025, promising that 100% of plastic packaging will be 100% reused, recycled or composted.
plastic
- Recycling and substitution of biomaterials could shave 2.5 million b/d off rising oil demand for plastics manufacturing by 2035 and that 60 percent of plastics used by 2050 could come from production based on previously used plastic.
- BP forecasts that the global war on plastics will be the main factor in cutting global oil demand faster than previously expected.
- Plastics make up 15% of crude oil demand, far less than transportation's over-50% share, and were expected to create major demand growth through 2040.
- Demand for oil will be limited in the coming decades if the world shifts from using plastics to alternatives to plastics.
- New chemical conversion process could transform the world's polyolefin waste, a form of plastic, into useful products, such as polymers, clean fuels and other items.
- Oil demand will mostly be driven to 2040 by the use of non-combusted liquid fuels in industry, particularly in petrochemicals, driven by demand for plastic.
waste
- US second-hand apparel retailer Savers has announced that, in the next stage of its campaign to divert American waste from landfill, it will have removed plastic bags from all its North American stores by the end of 2018.
- The Prime Minister has pledged that the UK will eradicate all avoidable plastic waste by 2042 as part of the government's 25-year plan to improve the natural environment.
- Prime Minister Theresa May has also announced that avoidable plastic waste will be phased out by 2042; a target which has been criticised by environmental groups for being unambitious.
- Oil giant BP has suggested in a new report that a potential global ban on single-use plastics to tackle climate change could lead to an increase in overall energy demand and food waste.
production
- Recycling and substitution of biomaterials could shave 2.5 million b/d off rising oil demand for plastics manufacturing by 2035 and that 60 percent of plastics used by 2050 could come from production based on previously used plastic.
- The scale of the plastic waste issue is getting worse, not better, with the production of plastics expected to double over the next decade.
- The European Union (EU) will launch a regional program in 2019 to strengthen cooperation with the Philippines and select countries in east and southeast Asia towards sustainable consumption and production of plastic which had been contributing to problems posed by climate change.
- Plastic Omnium expects stronger North American growth this year, particularly in bumper production for the new BMW X5 and new orders in Mexico.
- The single-largest projected source of oil demand growth over the next 20 years is from the non-combusted use of liquid fuels in industry, particularly as a feedstock for petrochemicals, driven by the increasing production of plastics.
bottle
- Following a successful trial in 2018, LRS has this year rolled out a new light weighted packaging concept across all of its 500 ml Ribena bottles - a move it claims will save 325 tonnes of plastic annually.
- PET bottles sold in the EU will have to contain at least 25 per cent recycled plastic from 2025, rising to 30 per cent by 2030.
- A message from UNESDA, Soft Drinks Europe: Our goal - by 2025, 100 percent of soft drinks plastic packaging will be recyclable with PET bottles and will contain a minimum of 25 percent recycled content.
- Plastic bottles will represent a major challenge for Nestlé - which makes billions by running 100 different water bottling operations in 34 countries across the world.
- More than 583 billion plastic bottles alone will be produced worldwide three years from now.
- The annual consumption of plastic bottles has been rising steadily and is expected to exceed half a trillion tonnes per year by 2021.
industry
- Oil demand will mostly be driven to 2040 by the use of non-combusted liquid fuels in industry, particularly in petrochemicals, driven by demand for plastic.
- The single-largest projected source of oil demand growth over the next 20 years is from the non-combusted use of liquid fuels in industry, particularly as a feedstock for petrochemicals, driven by the increasing production of plastics.
- The use and wastage of plastic across the pharma supply chain will continue to be a major focus in 2019, following a warning by the UN our oceans will contain more plastic than fish by 2050 unless all industries take action.
- The rate of plastics production is dramatically accelerating: Industry projects a 40 percent increase in the next decade.
- Compounding plastics industry will face new opportunities and challenges, resulting in turning towards a green, low-carbon, high performance-based, multi-function integrated direction.
- By 2050, oceans are expected to contain more plastics by weight than fish, while the plastics industry will consume 20 per cent of the total oil production.
product
- Expect to see plastic-free beauty shifting the way we buy and use products in the beauty sector next year, as consumers seek sustainability over reputability with eco-friendly brands like Lush leading the way.
- HP is making ink cartridges from plastic collected in Port-au-Prince, Haiti, and Ikea will begin prototyping products made from ocean-bound plastic next year.
- Christmas shoppers are being warned to avoid plastic toys after they appeared in more than half of EU intergovernmental alerts for products containing banned chemicals this year.
- Adidas expects to sell 5 million pairs of shoes made from ocean plastic this year and committed to using only recycled plastic in its products by 2024.
- UK supermarket chain Iceland will become the world's first supermarket to eliminate single-use plastic in its branded products within five years.
- The rising use of plastics and other petrochemical products will drive global oil demand to 2050.
growth
- Recycling plastic is estimated to be worth $54 billion by 2023, which with greater investments and policy support could lead to growth and new jobs.
- Energy Information Administration expect petrochemicals to lead growth in oil demand through 2040 as use of plastics grows in developing economies, particularly in Asia.
- Introduction of eco-friendly alternatives to the plastic trays such as fiber-based trays, bagasse or sugarcane trays, paper trays, and plant-based plastics are emerging as a threat in the growth of the plastic tray market.
- Demand for plastics means petrochemicals will account for more than a third of global oil demand growth by 2030 and nearly half of demand growth by 2050, adding nearly 7 million b/d by the middle of the century.
- The Global Electrical Plastic Market has shown an incredible growth in the past decades and is expected to reach an applaudable height in a coming decade too.
- Growing suppliers and manufacturers of thermoformed plastic products will fuel the industry growth.
- Plastics make up 15% of crude oil demand, far less than transportation's over-50% share, and were expected to create major demand growth through 2040.
bag
- The UK could begin transforming household food scraps into environmentally friendly plastic bags and cups, thanks to up to £60 million of new government funding.
- In 2017, the global Biodegradable Plastic Bags and Sacks market size was 1850 million US$ and is forecast to 2800 million US in 2025, growing at a CAGR of 5.3% from 2018.
- Europe is expected to lead the global plastic bags and sacks market in terms of revenue and is estimated to be followed by North America.
- From grocery bags and drinking straws to land use policy and global waste trade, regulating plastic waste will rise in prominence this year.
- Victoria's government has said it will ban plastic bags by the end of 2019, but NSW refuses to follow suit.
demand
- Increasing demand for high-performance plastics as a substitute to metals in automobiles on account of growing need for high efficiency and low weight materials is expected to drive the PEEK market.
- Demand for oil will be limited in the coming decades if the world shifts from using plastics to alternatives to plastics.
- Oil demand will mostly be driven to 2040 by the use of non-combusted liquid fuels in industry, particularly in petrochemicals, driven by demand for plastic.
- A ban on plastics would cause oil demand to rise more slowly by 2040, though demand will be dictated by what materials are used instead of practice.
- Demand for plastics means petrochemicals will account for more than a third of global oil demand growth by 2030 and nearly half of demand growth by 2050, adding nearly 7 million b/d by the middle of the century.
- Plastics make up 15% of crude oil demand, far less than transportation's over-50% share, and were expected to create major demand growth through 2040.
Questions
- What does the circular economy mean for the plastics sector?
- What replaces plastics?
- Who's bending the curve on reusing plastic?
Potential Responses
either on your own publicly, or collaboratively if our private client.
Contact us if you would like some free training with this Options method.
Custom Services
We can produce equivalent reports to this one on any topic for just $1,000 (Plus VAT in Europe). Market rates are usually at least five to ten times this price. Or, you can subscribe to our service and make these yourself at will and use the forecasts in private, collaborative workshops to develop your strategic responses in hours rather than the weeks and months of traditional foresight projects using these methods below:
Options | Gapfinder | Causal Layered Analysis | Scenarios | Three Horizons
Do contact us to see how we can help you track emerging uncertainty issues and developments as they are announced or reported.
Sources
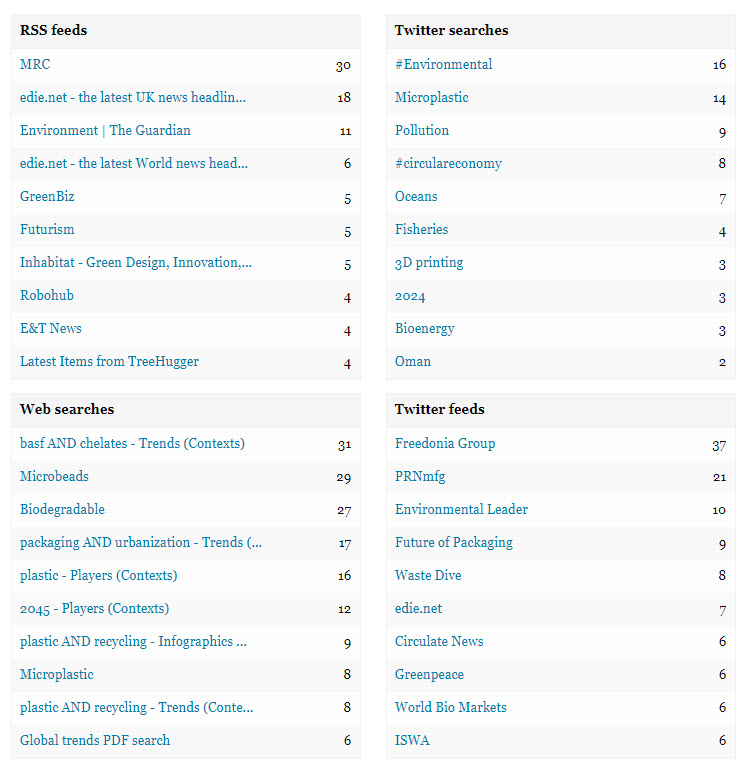
Athena used the sources below as the top ones to create this report and determined which embedded forecasts are included in this Trend Alert. She found 1,514 forecasts in seconds on 7th March 2019 to allow us to publish this report in less than two hours. She can turn these into PowerPoint slides and Audio files in minutes too as you wish, or we can prepare a full customized and professionally written brief for you to order covering all these forecasts.
Athena
Athena does show duplicates to aid your understanding of themes as well as contradictory forecasts. She may also show near-duplicates. You can speed read past the duplicates and near-duplicates if you wish, though the latter may show additional information. You can use the contradictory, and likely uncertain forecasts she finds to imagine different scenarios. The future is unpredictable, but we can examine the possibilities and choose our preferable future from the choices she presents.
Athena is apolitical. She will report forecasts from different viewpoints however distasteful that might be to our own values. Wearing rose-colored glasses is not her purpose; reporting potential futures is. So, we recommend you check her veracity before responding to her extracted forecasts.
Just like humans, Athena can be fallible. Do recognize that you and your associates are biased too. But whereas you tire, make mistakes and only recognize what interests you, she does not. She might miss or misinterpret as you do, but with far less frequency and she'll take uncomfortable truths and alternative ideas in her stride. But, please let us know if you feel her bias can be reduced. We want to do our best for you. And, as with any research, you should check and triangulate her findings for yourself.
Keep up to date
You can stay bang up to date on this topic or choose from our many automatic reports to determine what's next in seconds.
Global goals | Social changes | Sector prospects | G20 watch | Key Organizations
You can also ask us to set-up private topics for you (clients only) to achieve the same thing as this Trend Alert for your associates or set up email subscriptions (Registration required) on your favorite subjects.